visual narratives
2018 - 2019
MA Graphic Design Research
University of Portsmouth
SKILLS
Data Collection & Interpretation
User Testing
Illustration & Layout Design
Laser Cutting
Large Format Printing
Project Managment
BRIEF
During my MA degree, I explored the parameters of information design. The project was submitted to the University's academic board and received a Distinction - the highest level of grading possible. Below is my official thesis as well as an overview of the final project.
This project explores unique ways in which data associated with hydraulic fracturing in the USA can be visualized. By transforming the data into two-dimensional visualizations paired with three-dimensional sculptural adaptations, the artifacts offer alternative approaches to view complex data. Focus groups and observations revealed increased levels of engagements with the visuals and therefore topic. Viewers were more likely to interact with the information with the presence of physical models and were more intrigued by the content with the use of abstract data charts compared to traditional data charts. The outcome not only educates and provides an objective interpretation of the topic but encourages engagement with the information, opening the data to a broader audience.
The project consists of five posters paired with five interactive models. Due to the focus on physical interaction with data, tangible models were created and paired with printed posters. The first poster offers an introduction to the approach taken while providing a sneak peek of the content. It also serves as an instruction manual for the assembly of some of the models.

1
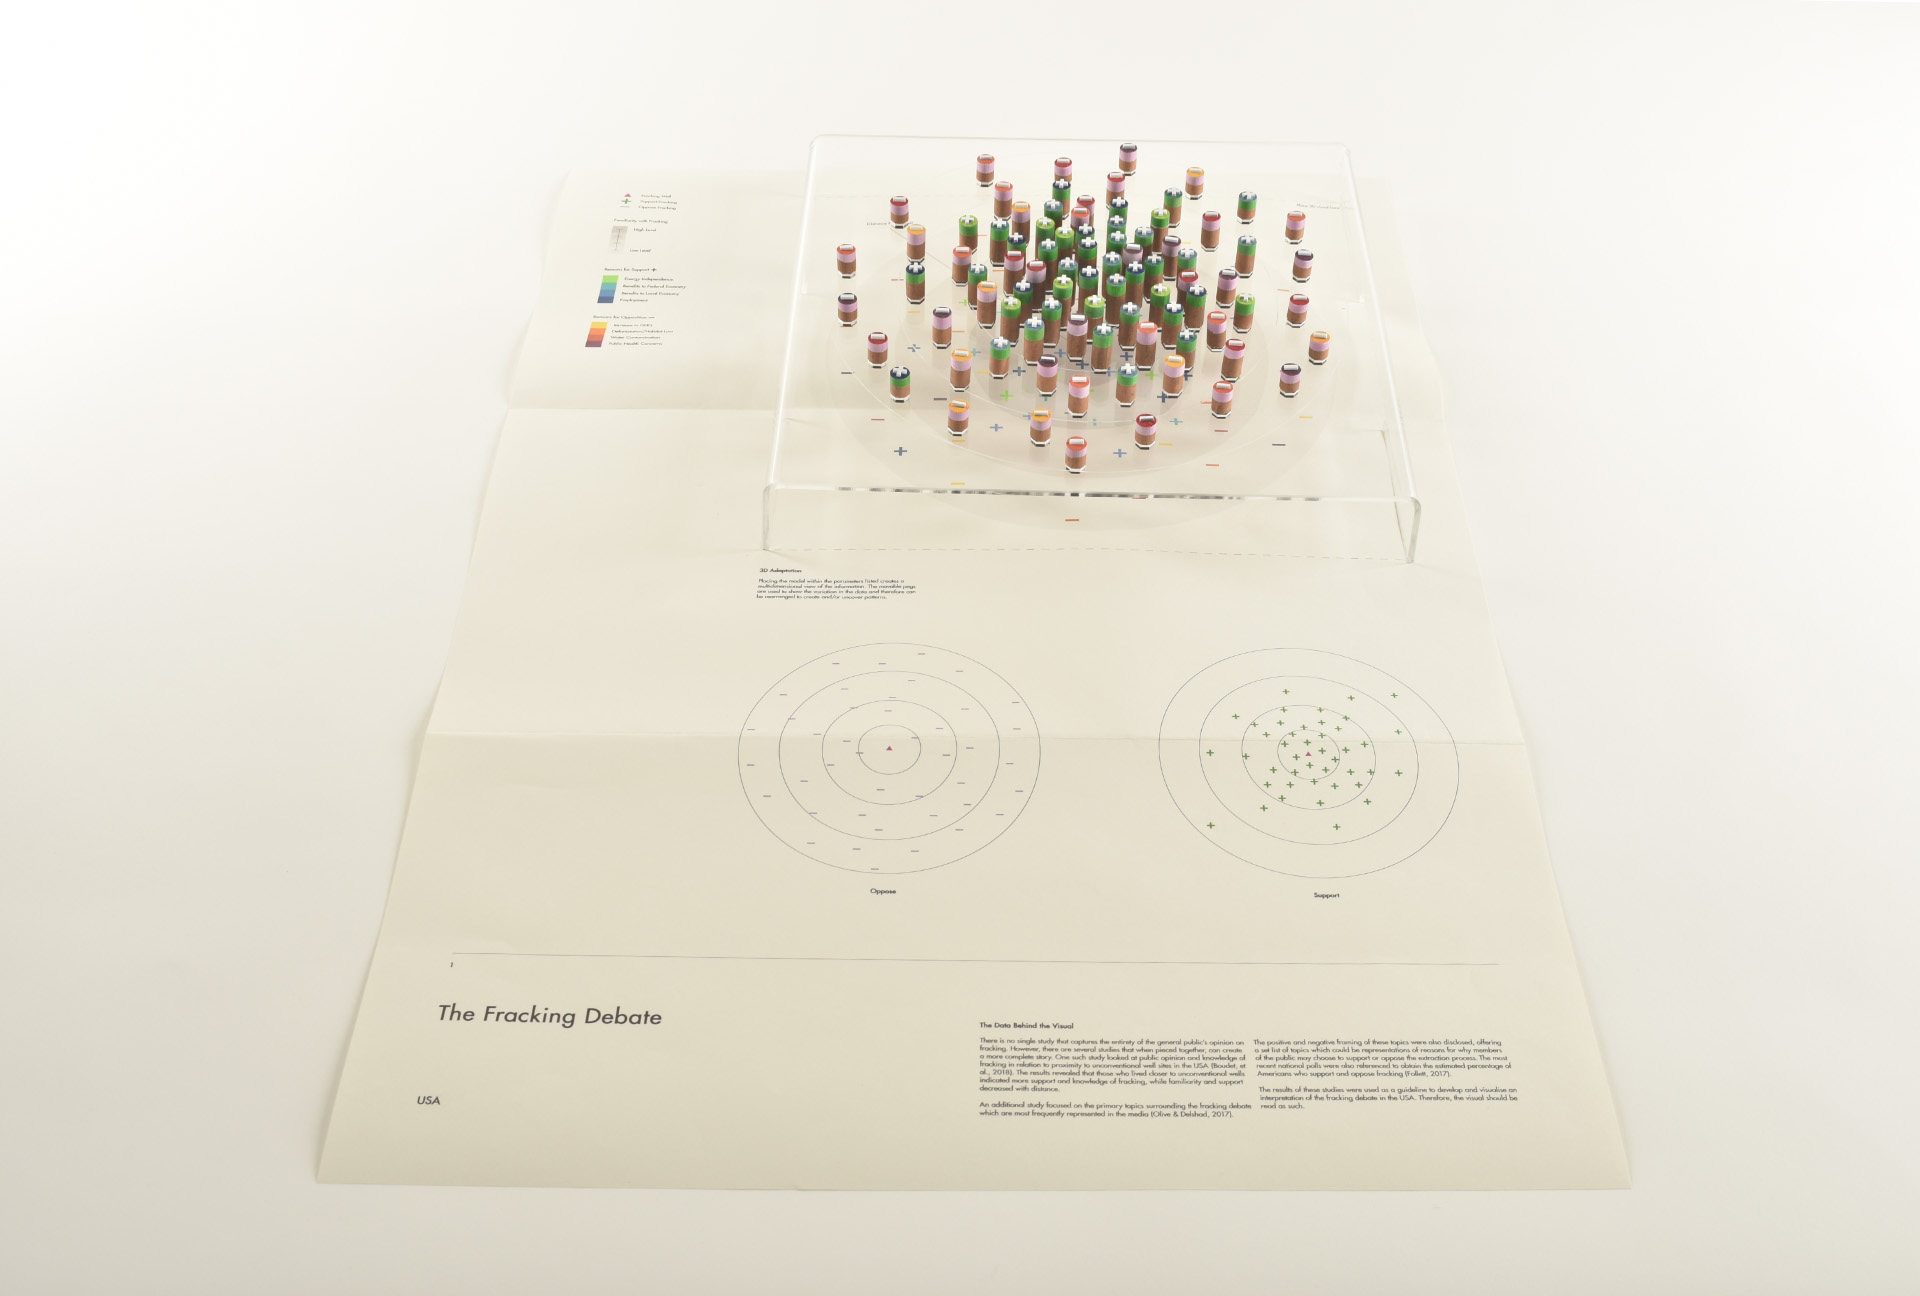
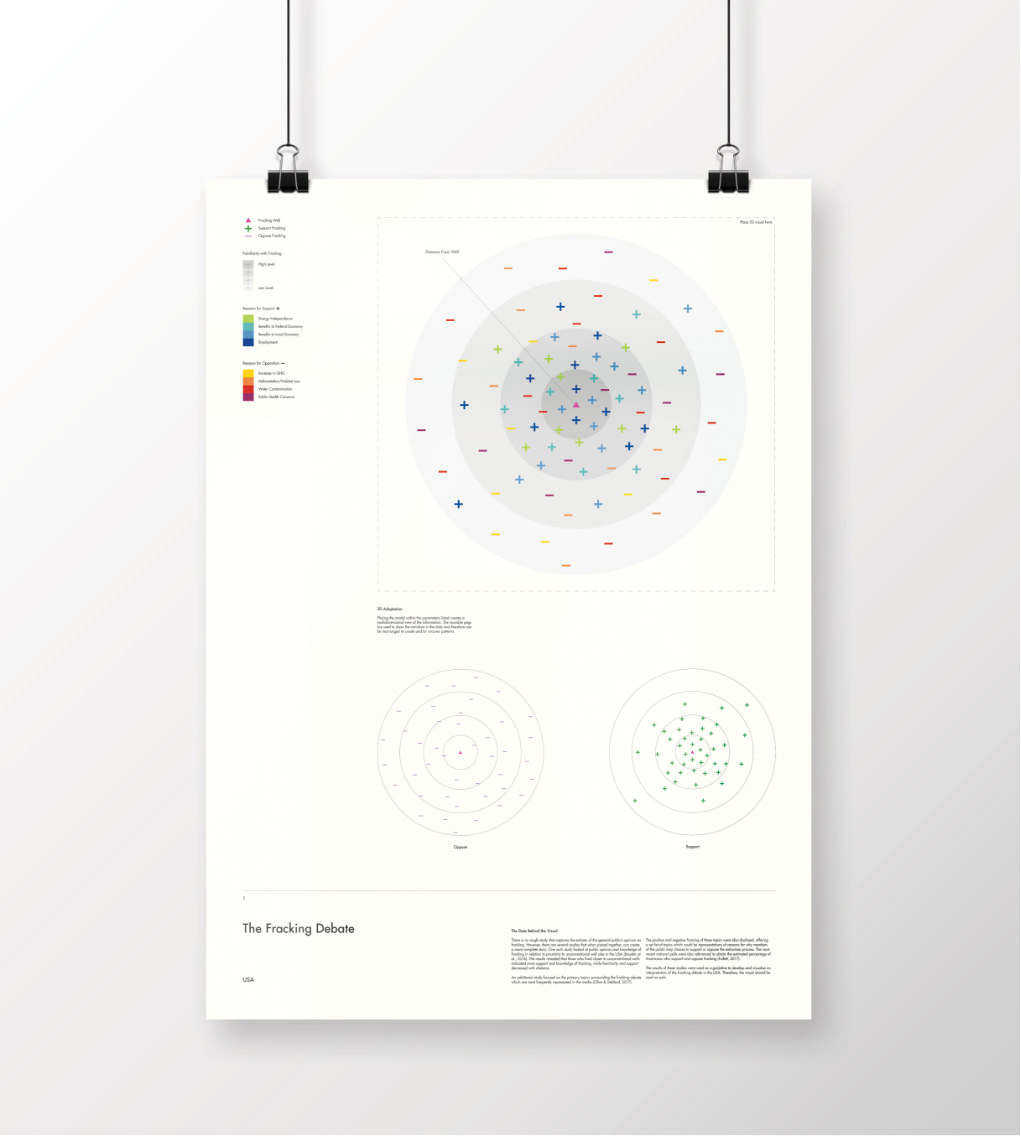
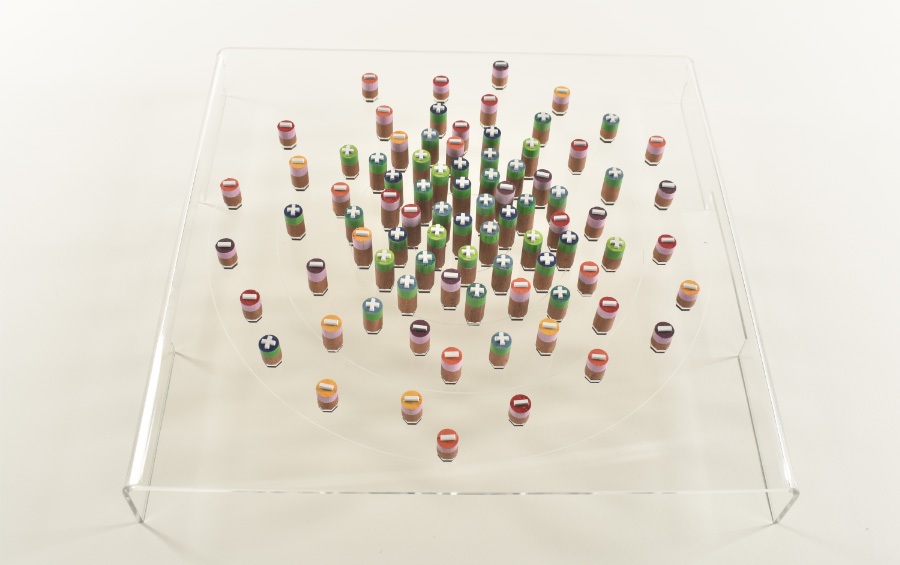
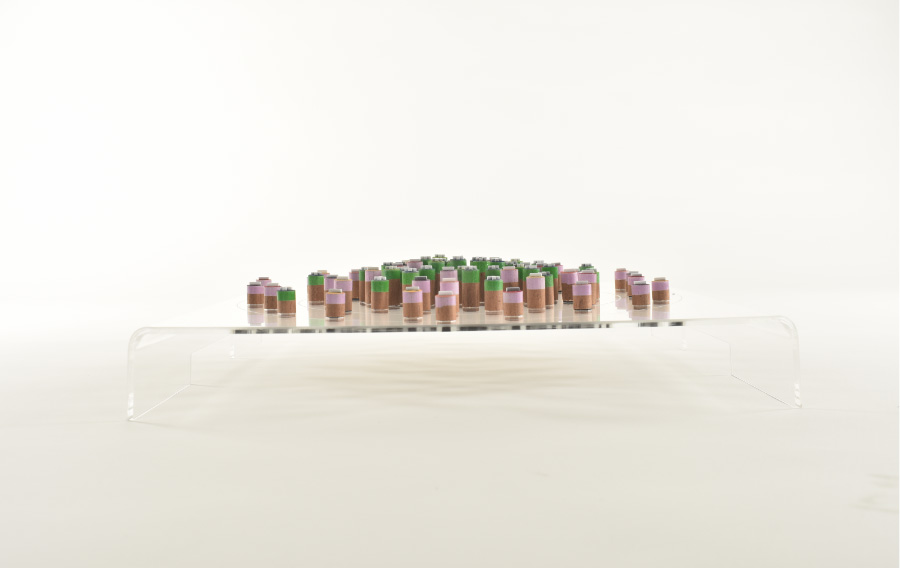
THE FRACKING DEBATE
This visualization creates a foundation to help begin to understand the fracking debate in the USA. It shows the spread of opinions and popular reasoning behind why people choose to support or oppose this extraction process. The reasons listed directly relate to the content of the remaining four visuals and therefore acts as a base from which the other topics stem. The poster is paired with an interactive peg sculpture representing the same content. The movable pegs offer the flexibility to rearrange the data which underlines the impermanent and purely representative nature of aspects of the visual.
2
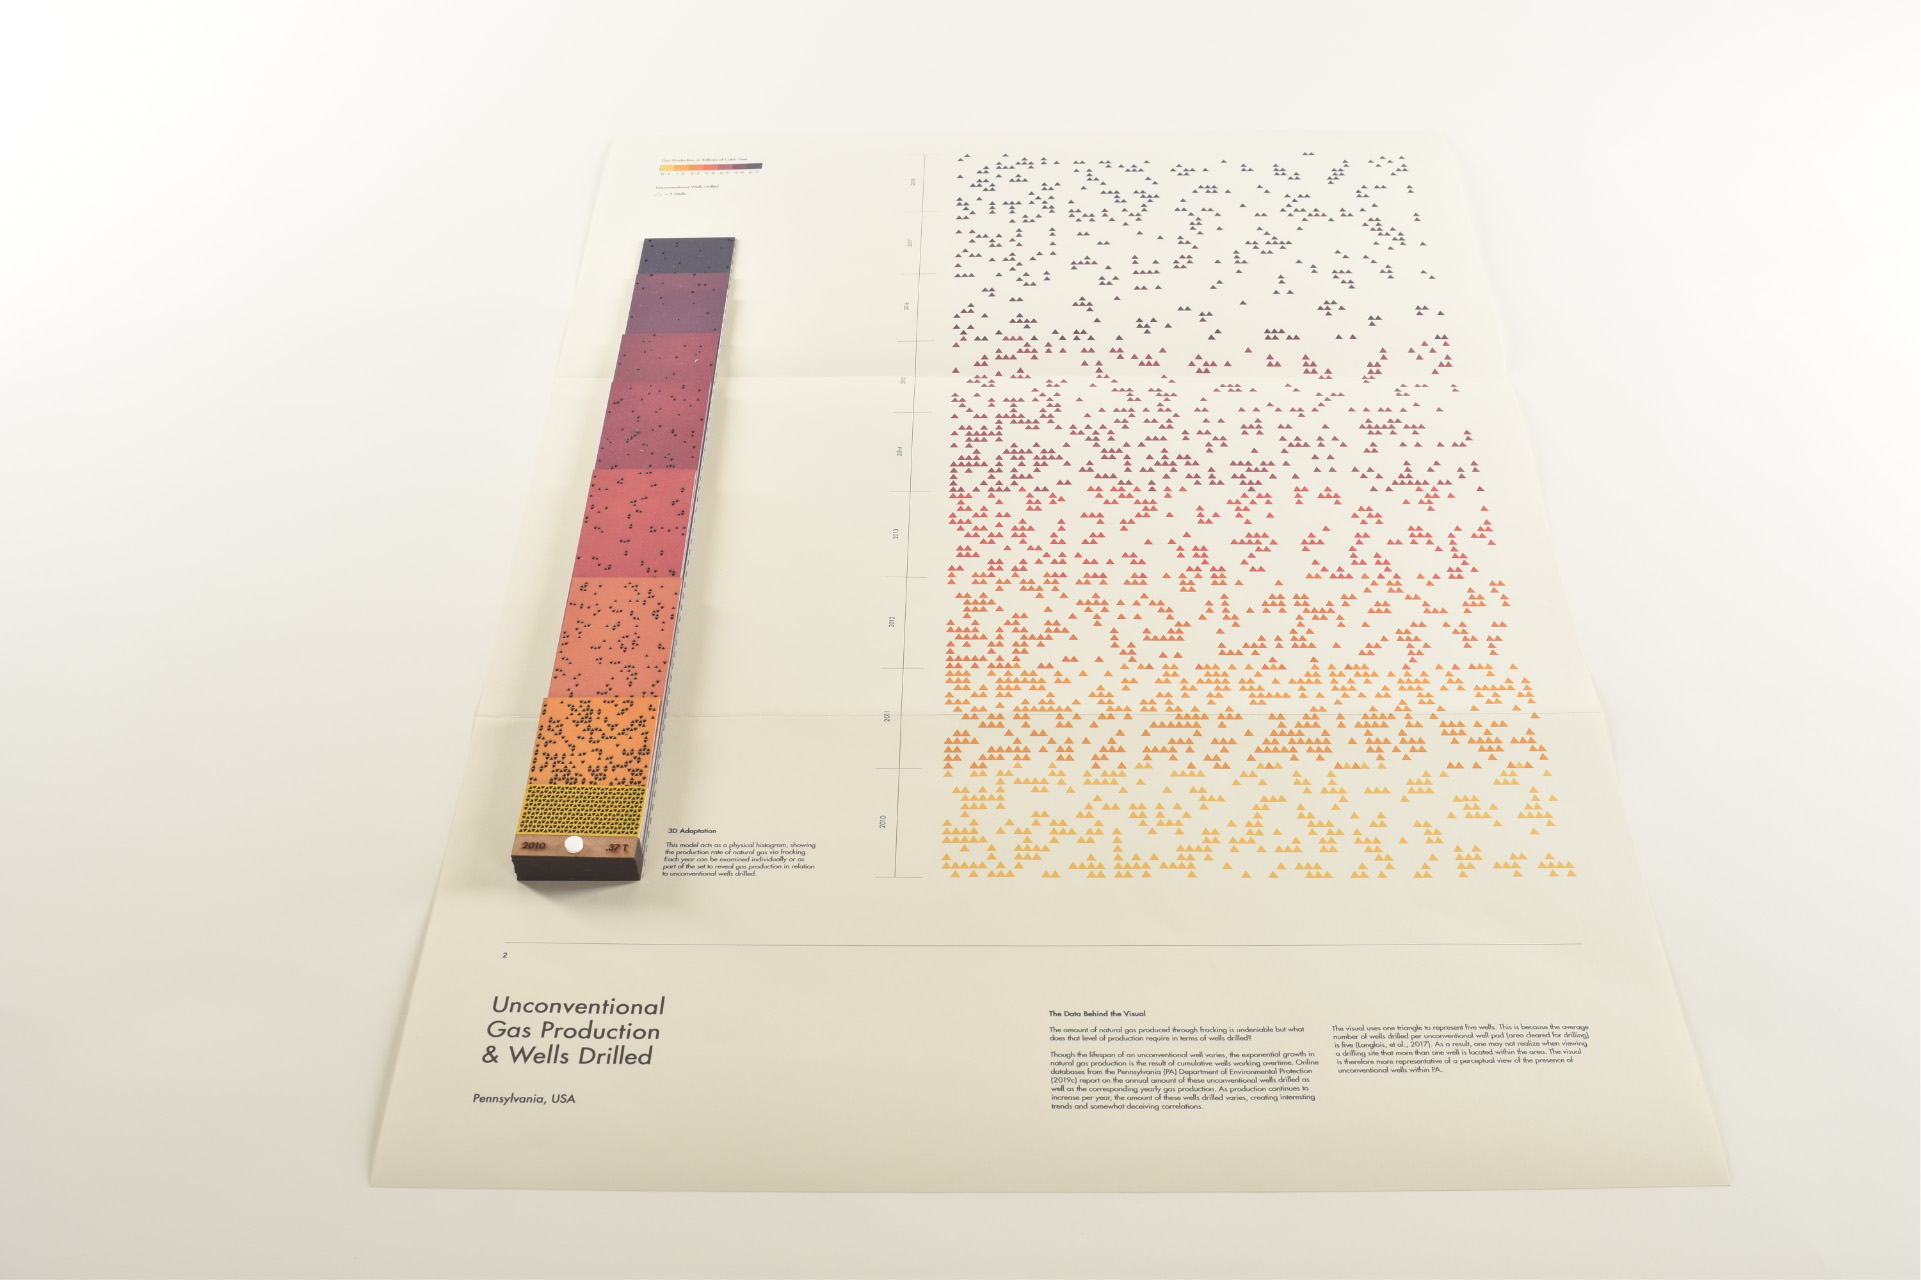
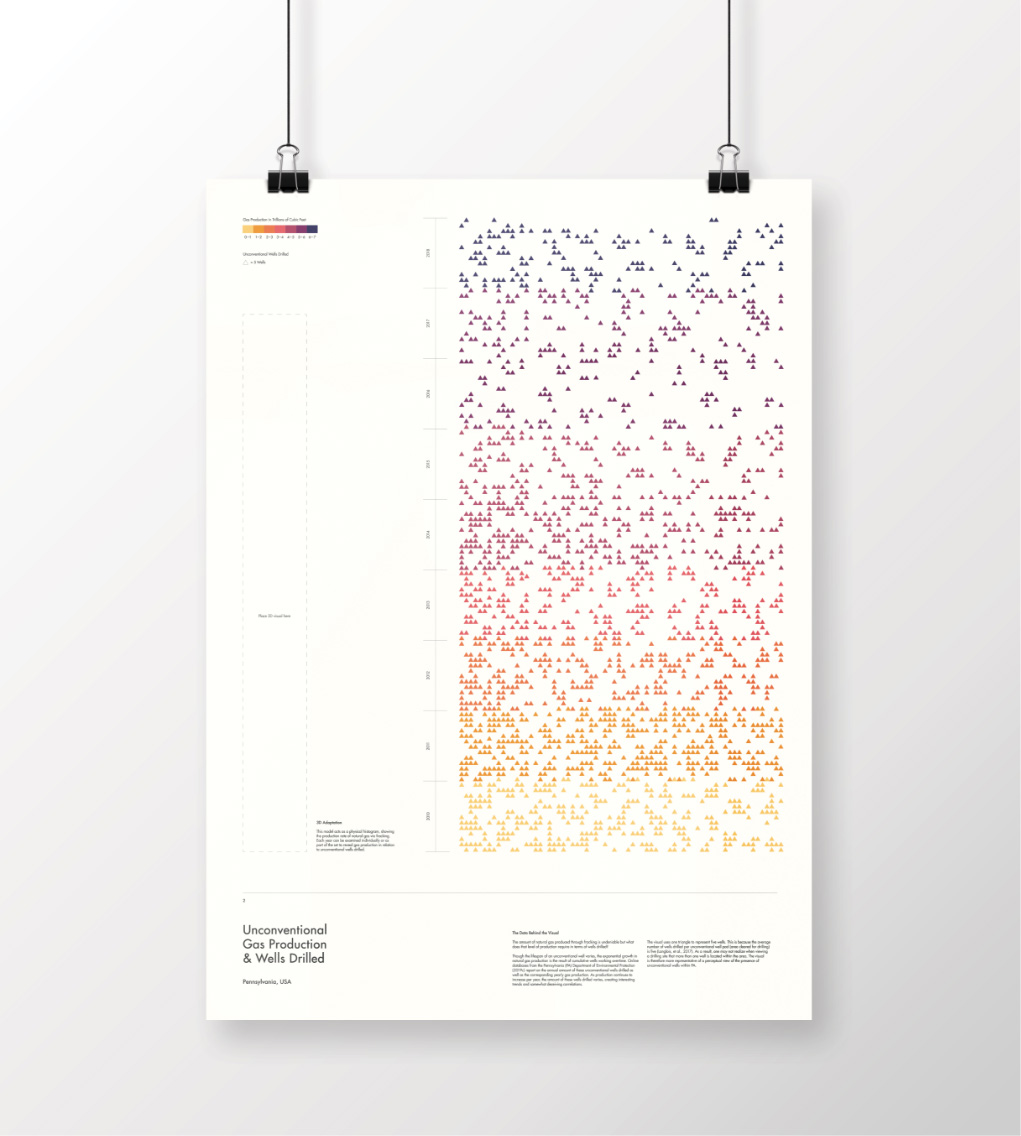
UNCONVENTIONAL GAS PRODUCTION & WELLS DRILLED
Data surrounding natural gas production along with unconventional wells drilled in Pennsylvania are represented. The visual aims to show the number of wells drilled in relation to the resulting production of gas over the past ten years. While the printed version highlights the impactful number of wells drilled throughout the years, the three-dimensional adaptation focuses more on the exponential growth in natural gas production. The sculptural visual acts as a physical histogram, directly relating to the content listed within the printed visual.

3
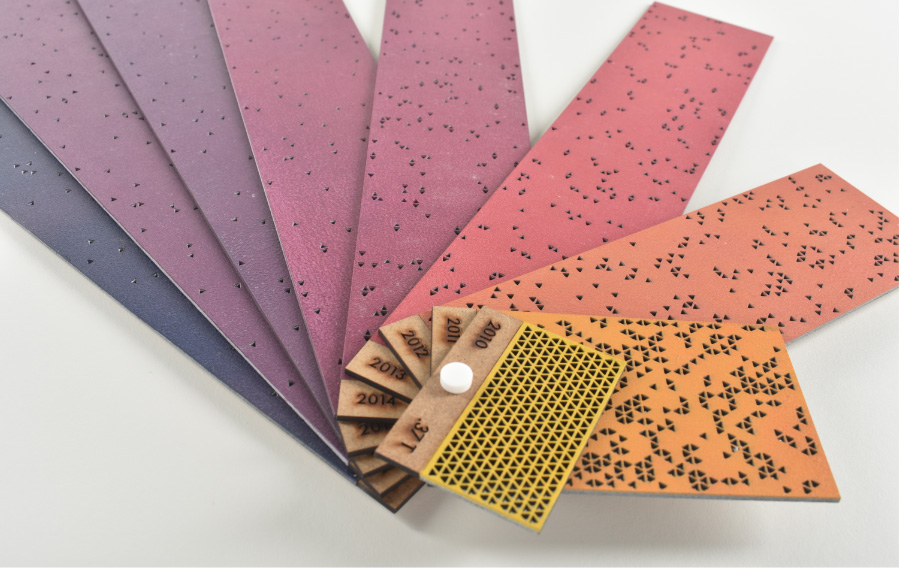
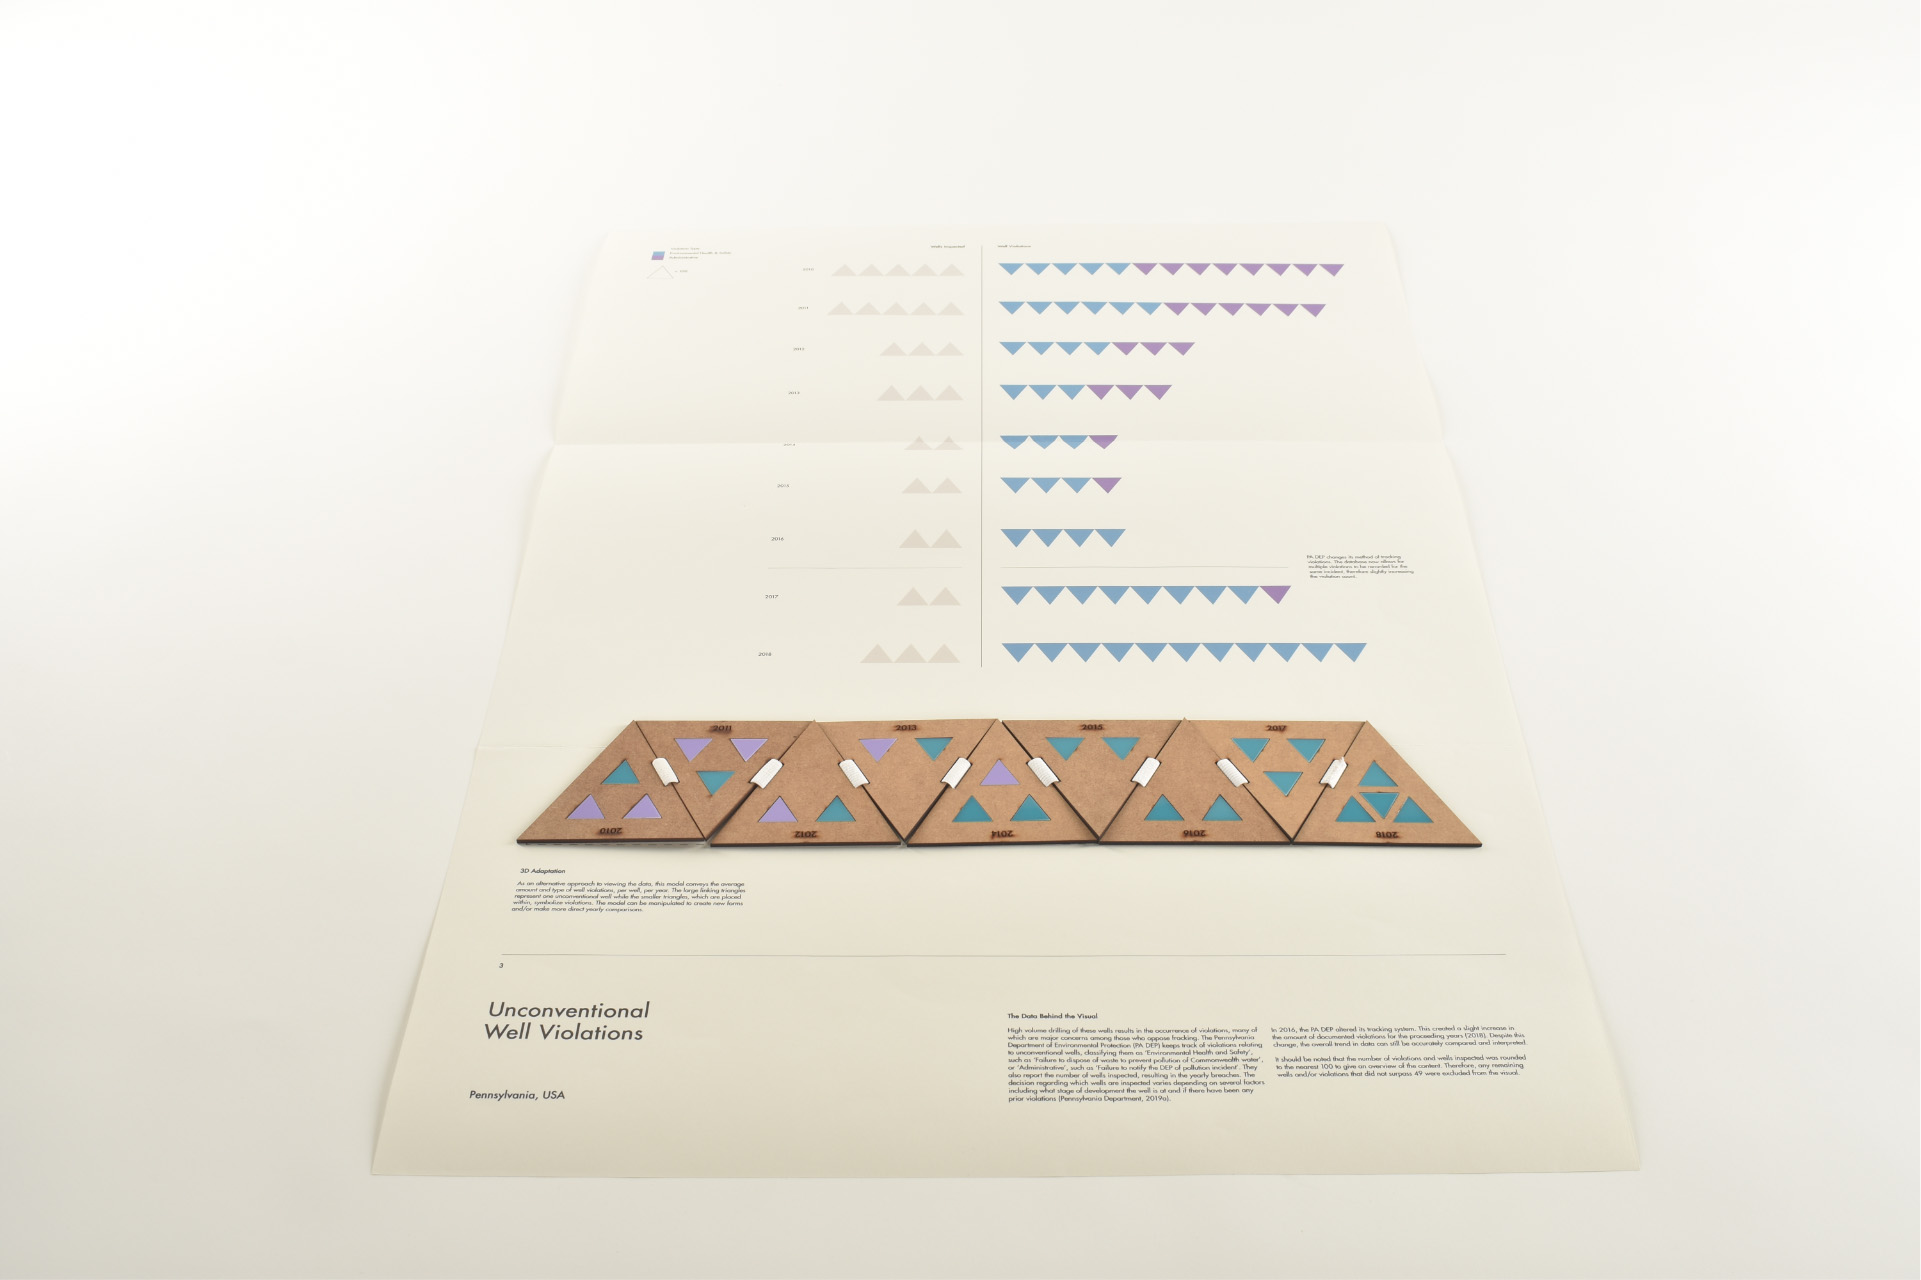
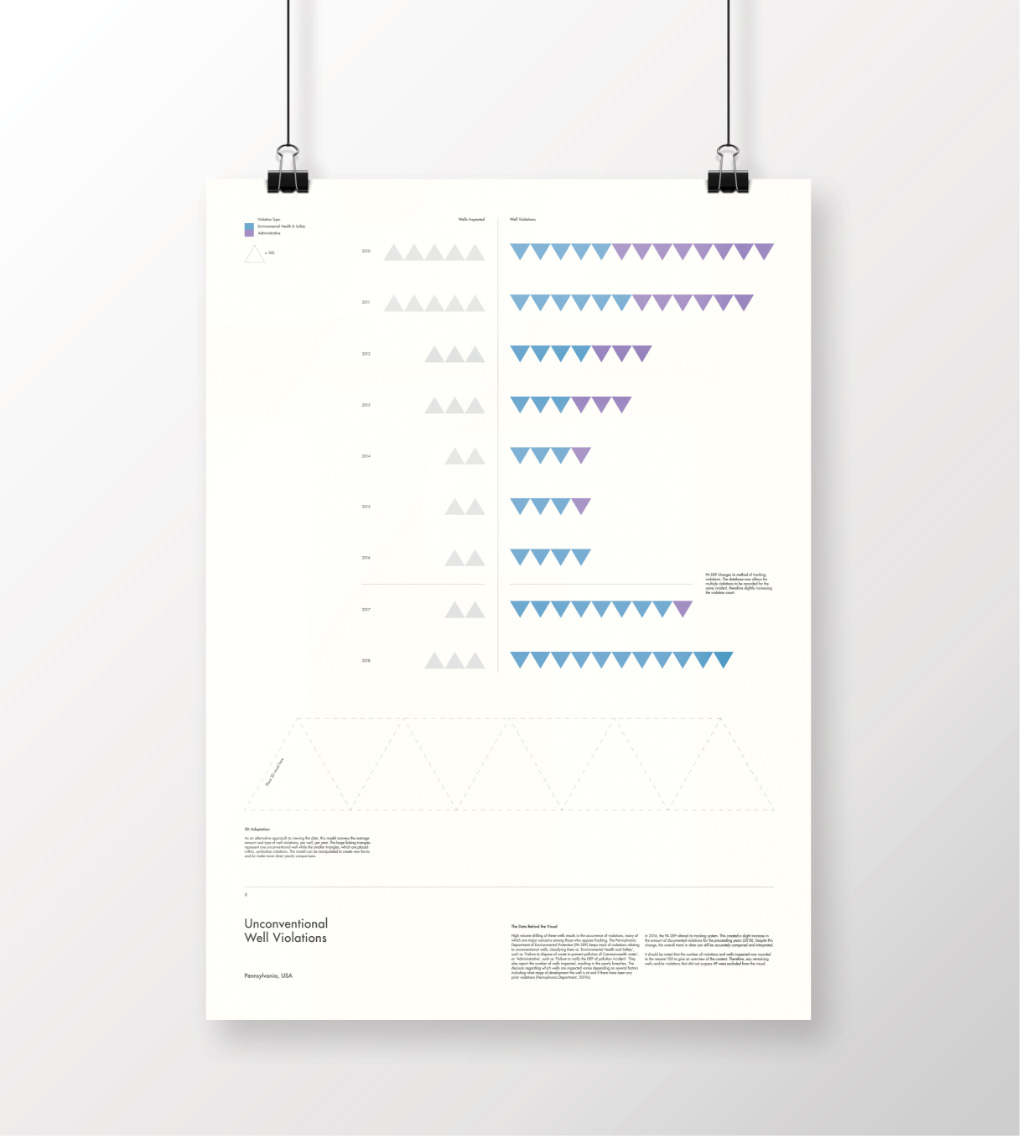
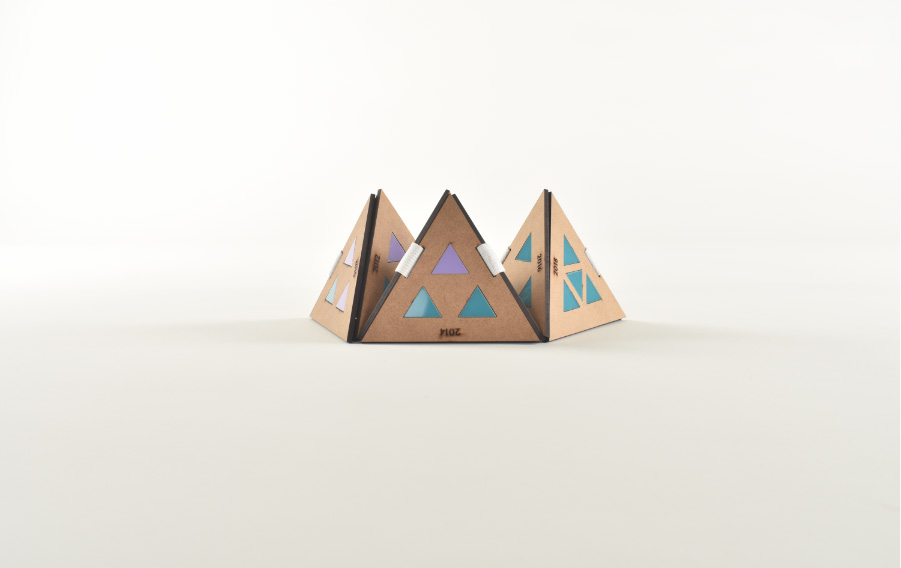
UNCONVENTIONAL WELL VIOLATIONS
This visual highlights the issue of unconventional well violations. The printed visual offers an overview of the number of violations per year as well as the type of violation. However, each well can have more than one violation. To clarify this aspect of the data, the three-dimensional visual is used to show the average number of violations and violation types there were per well, per year. The result is a linked chain of triangles. Each larger triangle represents one well while smaller triangles sit inside, representing the violations. The model can be used to make comparisons or simply manipulated into different forms.

4
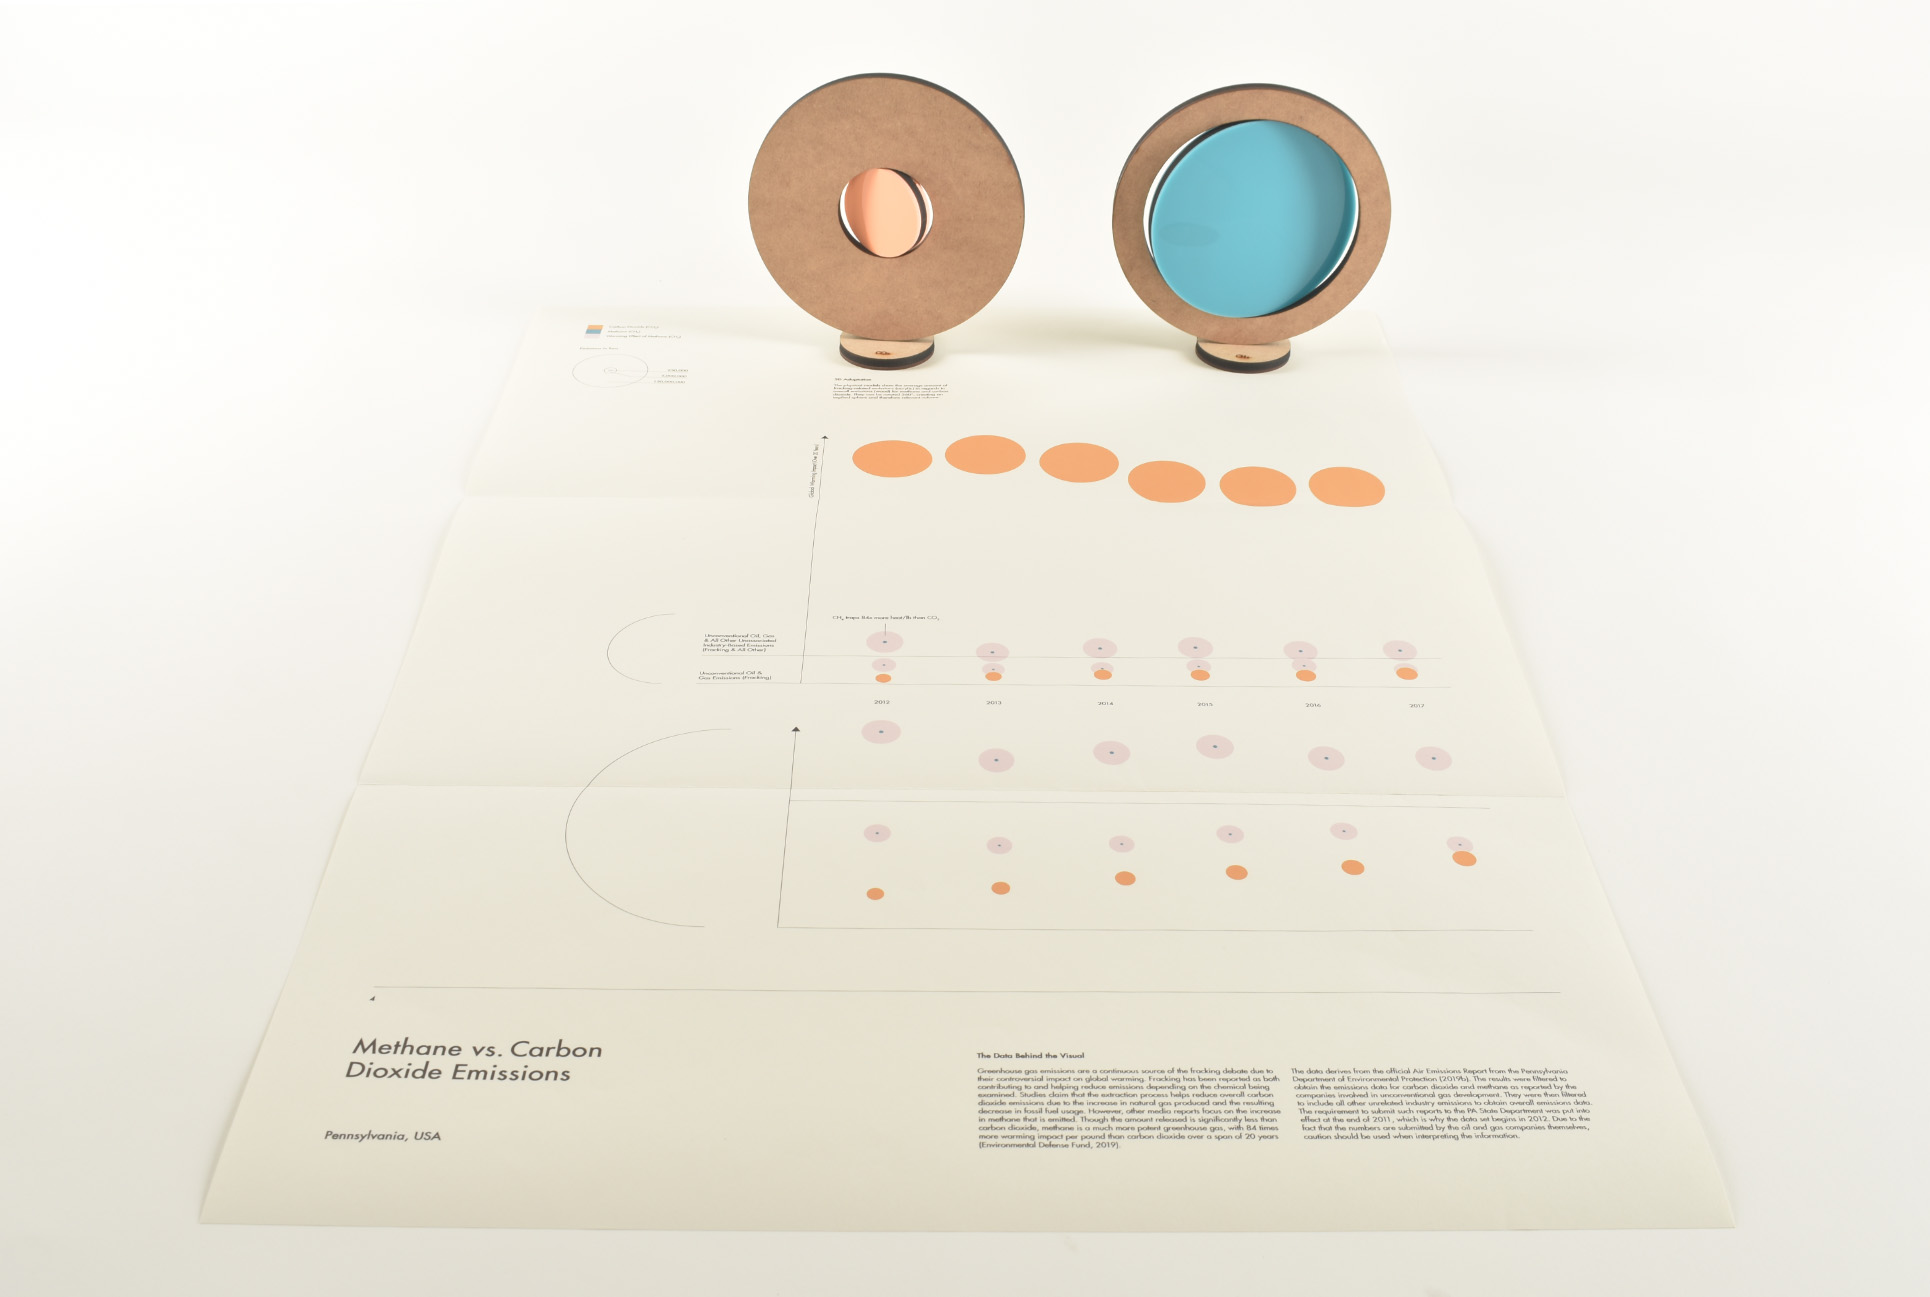
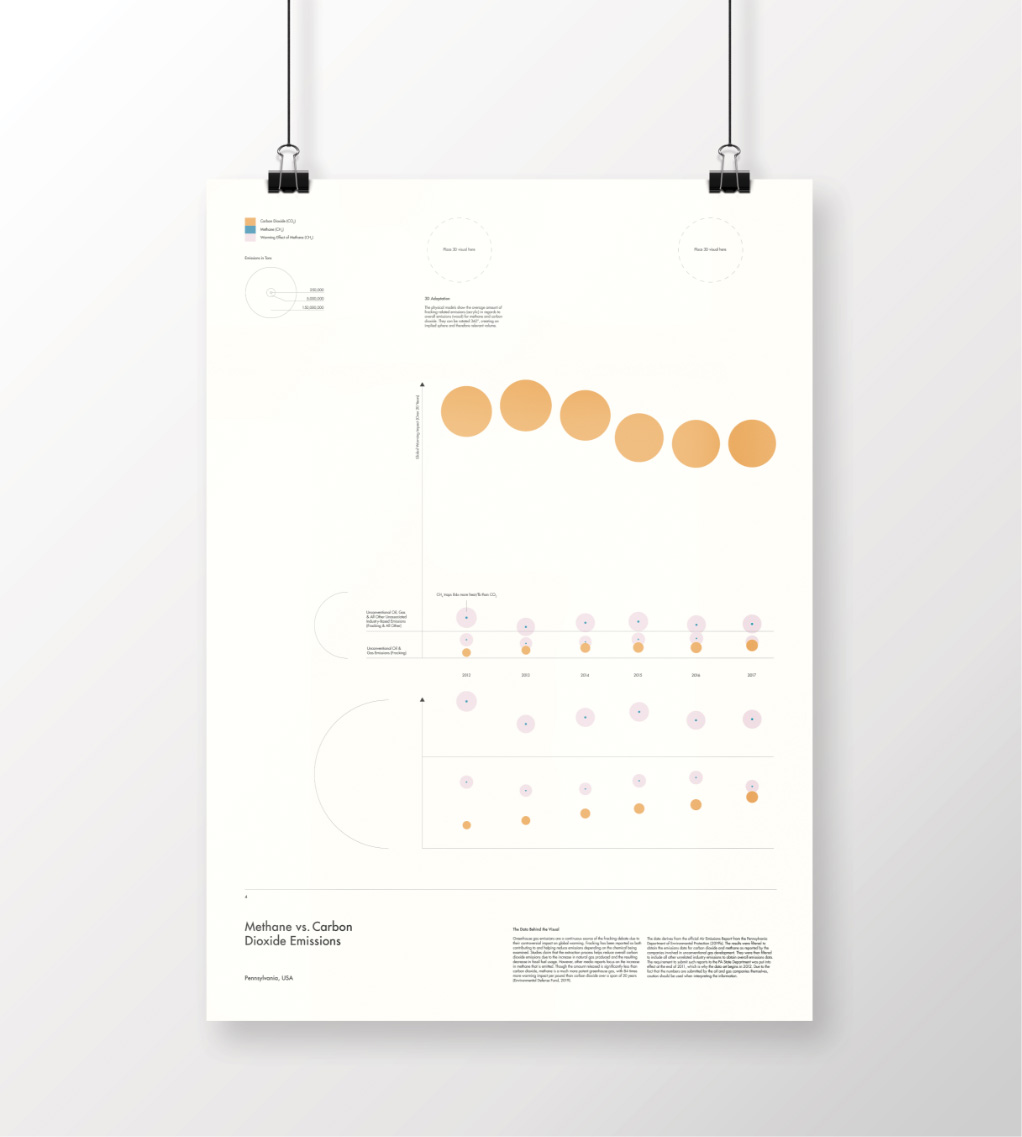
METHANE VS. CARBON DIOXIDE EMISSIONS
Greenhouse gases are another aspect of the fracking debate. The visual focuses on carbon dioxide and methane emissions. Both are displayed within the printed visual, showing the yearly trend from fracking as well as overall emissions including fracking. This is paired with two sculptural models that focus on the impact fracking has on the overall average emissions per year. Through interaction, it becomes clear that fracking contributes far more to methane emissions than it does carbon dioxide. However, referencing the printed visual, there is still far more carbon dioxide being released.


5
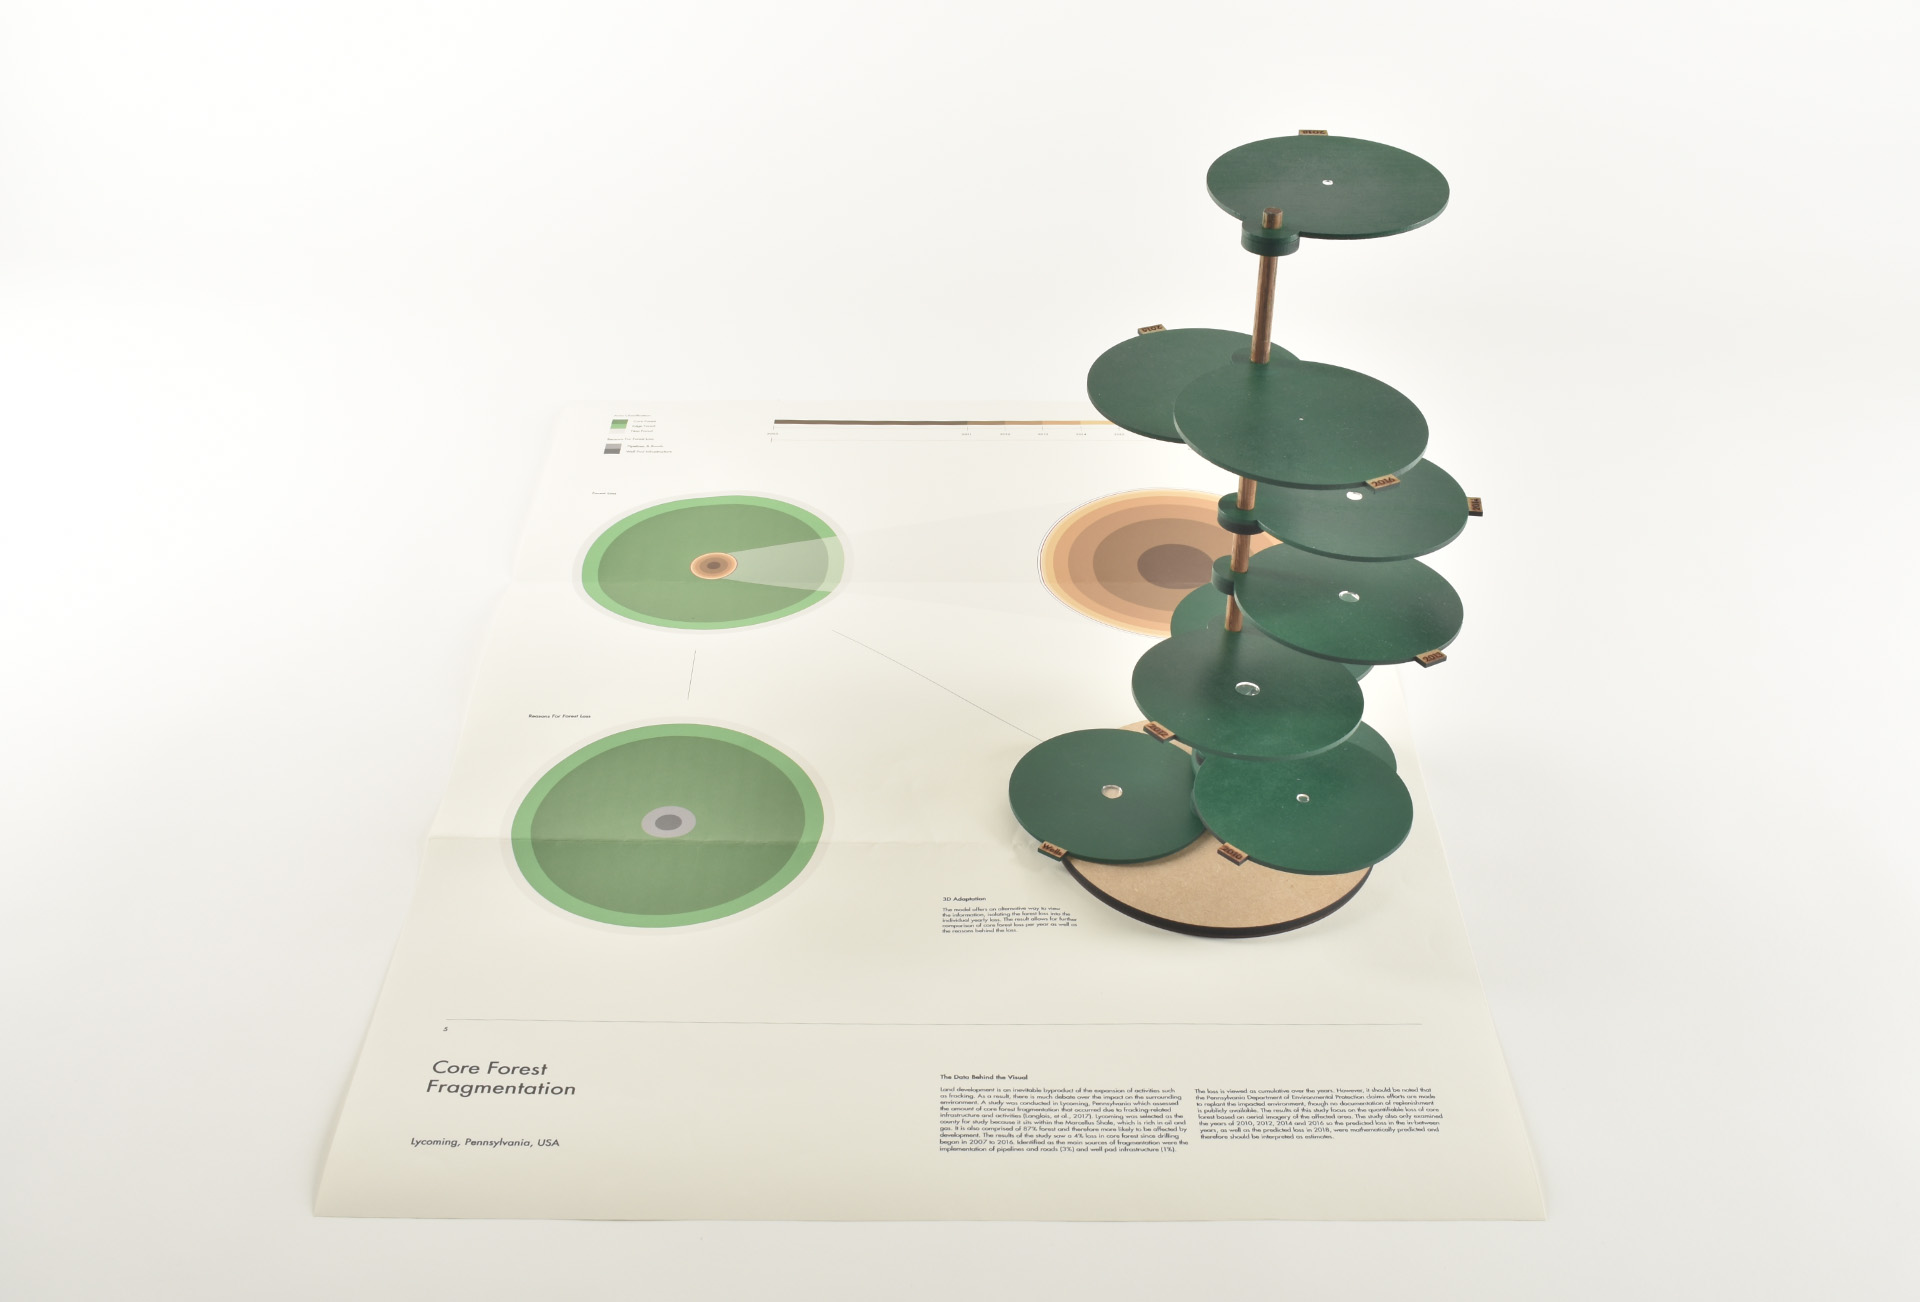
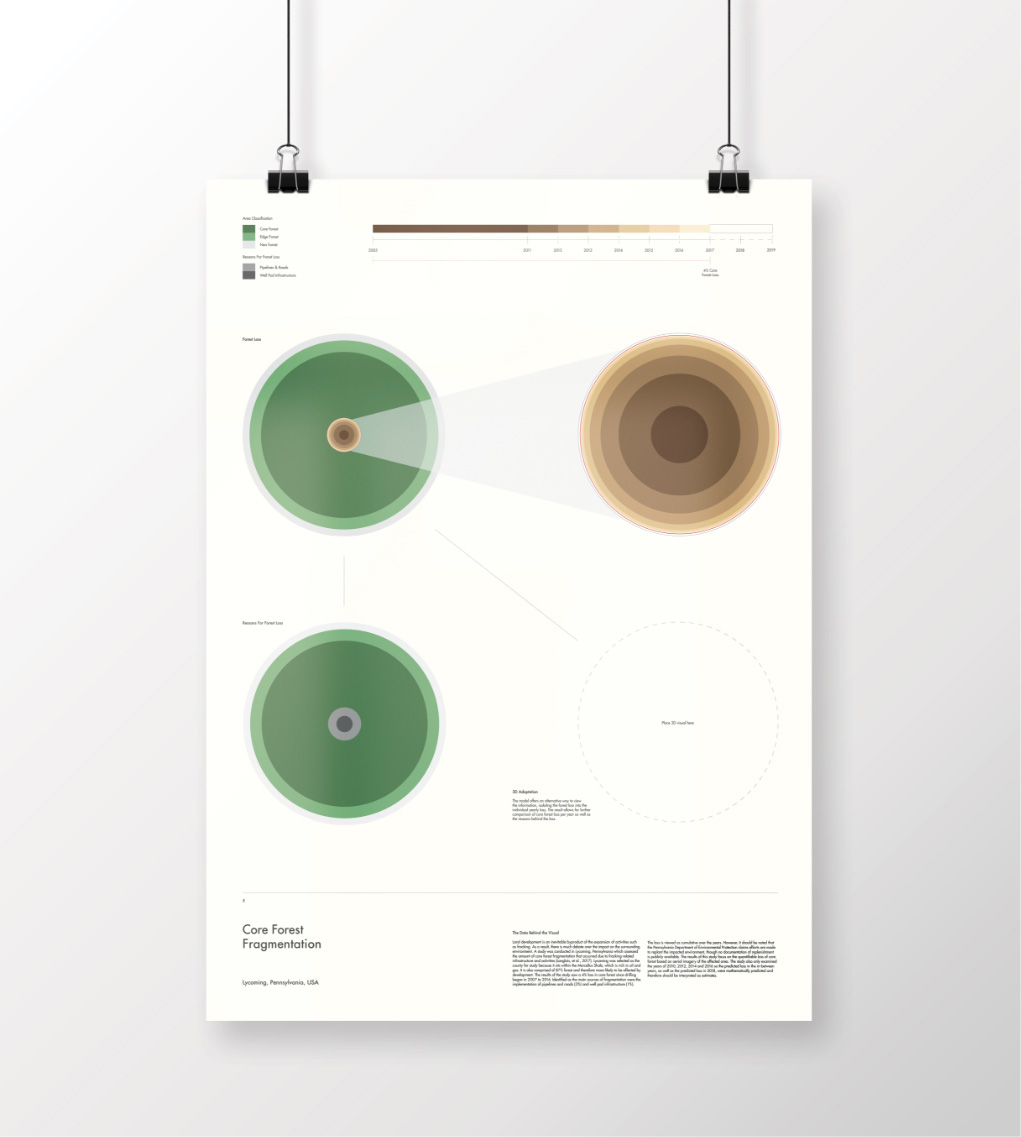
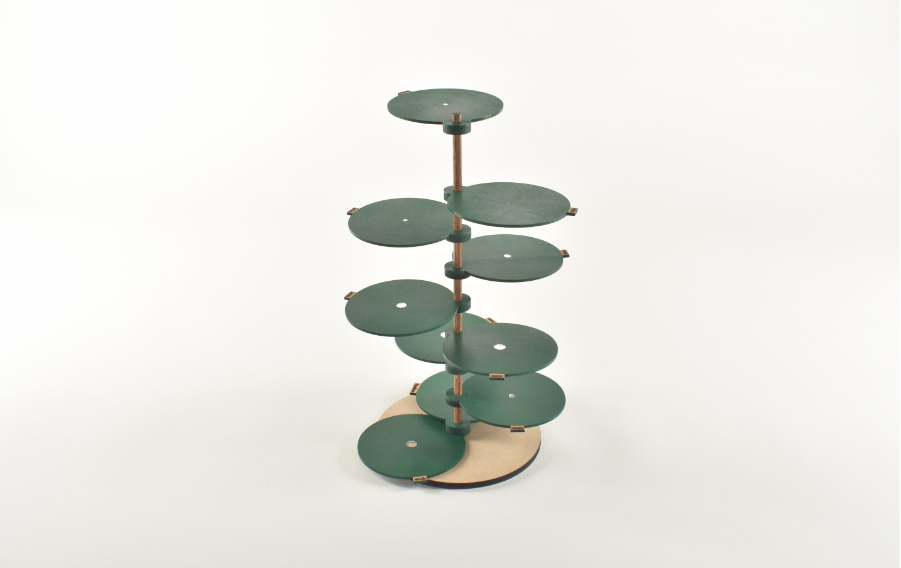
CORE FOREST FRAGMENTATION
This visual is based around core forest fragmentation due to the development of fracking-related infrastructure in Lycoming, PA. The printed visual shows the impact as cumulative loss over time. However, the sculpture adaptation provides the ability to compare yearly loss, using circular discs in reference to the circles used within the printed visual. The discs display holes that represent the core forest loss for that year. They then sit chronologically stacked on an oak pole, which represents the primary tree type that populates these affected forests. The distance between each disc represents years.